

Which industries will be affected by the suspension of the China-Australia Strategic Economic Dialogue
On May 6, 2021, the National Development and Reform Commission announced the indefinite suspension of all activities under the China-Australia Strategic Economic Dialogue mechanism jointly led by the National Development and Reform Commission and relevant departments of the Australian Federal Government. This means that China and Australia will adopt a negative attitude towards trade in goods and other related activities. In this case, which industries will be affected in the foreign trade between China and Australia. Let’s take a look at the recent years between the two countries’ trade data.
The dialogue started in 2014, and in December 2015, the China-Australia Free Trade Agreement officially signed by the Chinese and Australian governments came into effect.
Since the free trade agreement came into effect at the end of 2015, China’s imports and exports to Australia have both increased to a certain extent, and China is dominated by imports.
In 2020, China’s imports from Australia were US$114.84 billion, a decrease of 3.99% year-on-year in 2019, compared to the 2016 compound annual growth rate of 12.81%; exports were US$53.48 billion, a year-on-year increase of 2019 US$1.118 billion, compared to the 2016 Compound Annual Growth Rate of 9.44%.

From Australia’s point of view, Australia’s exports are much larger than imports. In 2020, Australia’s imports to China will be 61.05 billion U.S. dollars, an increase of 7.21% year-on-year in 2019, compared with a compound growth rate of 8.38% in 2016; exports were US$100.09 billion, a decrease of 2.83% year-on-year, compared with a compound growth rate of 13.65% in 2016

From the perspective of the proportion of imports in 2020: Australia is China’s fourth largest source of imports, but China’s sources of imports are relatively scattered. Australia, which ranks fourth, accounts for only 5.59% of imports.
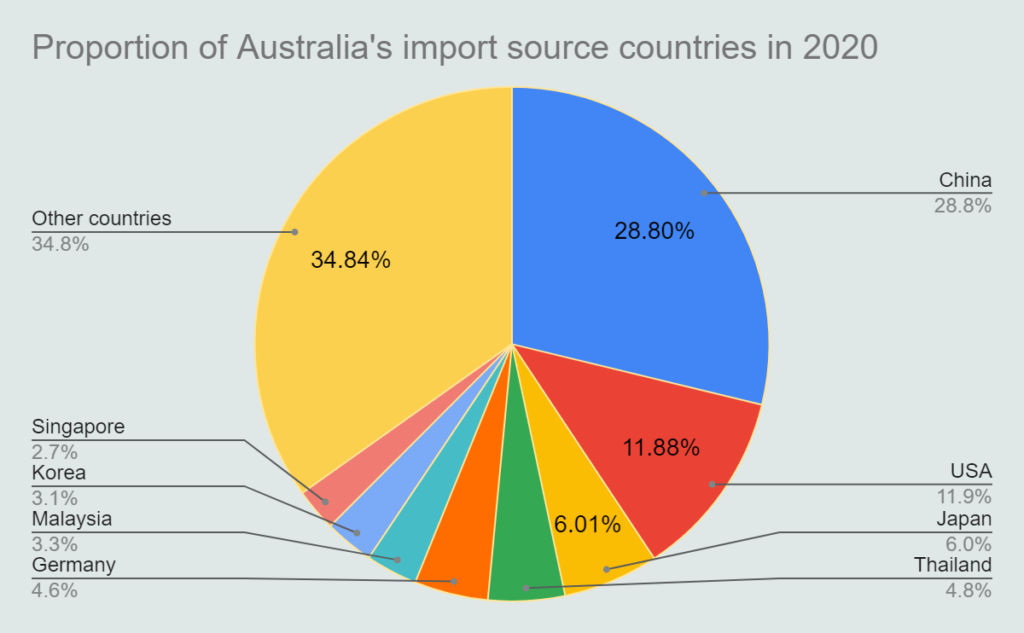
On the other hand, China is Australia’s largest source of imports, and the amount of imports from China accounted for a relatively large amount, 28.80% of the total import amount in 2020.

From the perspective of Sino-Australian economic and trade relations, China is Australia’s largest trading partner, largest export destination, and largest source of imports. According to the import and export data of the two countries, we can see that different industries in the two countries will be affected.
In 2020, China’s imports from Australia accounted for the largest proportion of iron ore and concentrate imports, accounting for 61.69%, indicating that China’s main imports from Australia are mining and metallurgy, and the main purpose of imports is the purchase of metallurgical raw materials.
The import volume is followed by fossil fuels such as petroleum gas and coal, of which petroleum gas imports accounted for 9.41%, and coal imports accounted for 6.87%. At the same time, it can also be explained that among Australia’s exports to China, iron ore and petroleum gas are the main commodities.
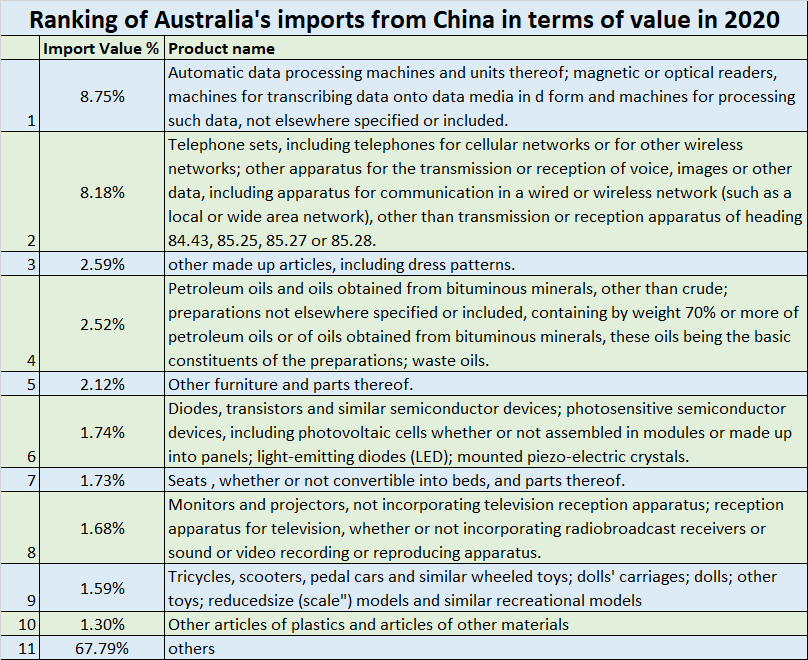
As for the composition of Australia’s imports from China in 2020, the main products imported from China are mechanical and electrical products, textiles, furniture, toys and miscellaneous products. In 2020, Australia’s imports of automatic data processing machines and magnetic or optical readers from China account for 8.75%, ranking first; followed by telephones and other products accounted for 8.18%. It can be seen from the data that the main commodities that Australia purchases from China are data processors, telephones and other mechanical and electronic products.
In 2020, China’s iron ore and concentrate imports totaled 118.94 billion U.S. dollars, of which 70.84 billion was imported from Australia, accounting for 59.56%, ranking first among the countries (regions) of import sources. From the perspective of Australia’s iron ore and concentrate export destination countries in 2020, 80.12% of the value goes to China (excluding Hong Kong). Therefore, it can be said that China is an absolute buyer of Australian iron ore and concentrate.
In 2020, Australia’s imports of automatic data processing machines and other products were 7.37 billion yuan, of which China’s imports were the largest at 5.34 billion US dollars, accounting for 72.47%. It can be seen that Australia’s import demand for electronic technology products such as China’s automatic data processors still accounts for a large proportion. When the economic dialogue is suspended, Australia’s related industries need to bear a certain risk of supply interruption or bear the burden of imported products from other countries or additional cost.
(The above relevant data comes from the United Nations trade review and forward-looking industry research)